Background
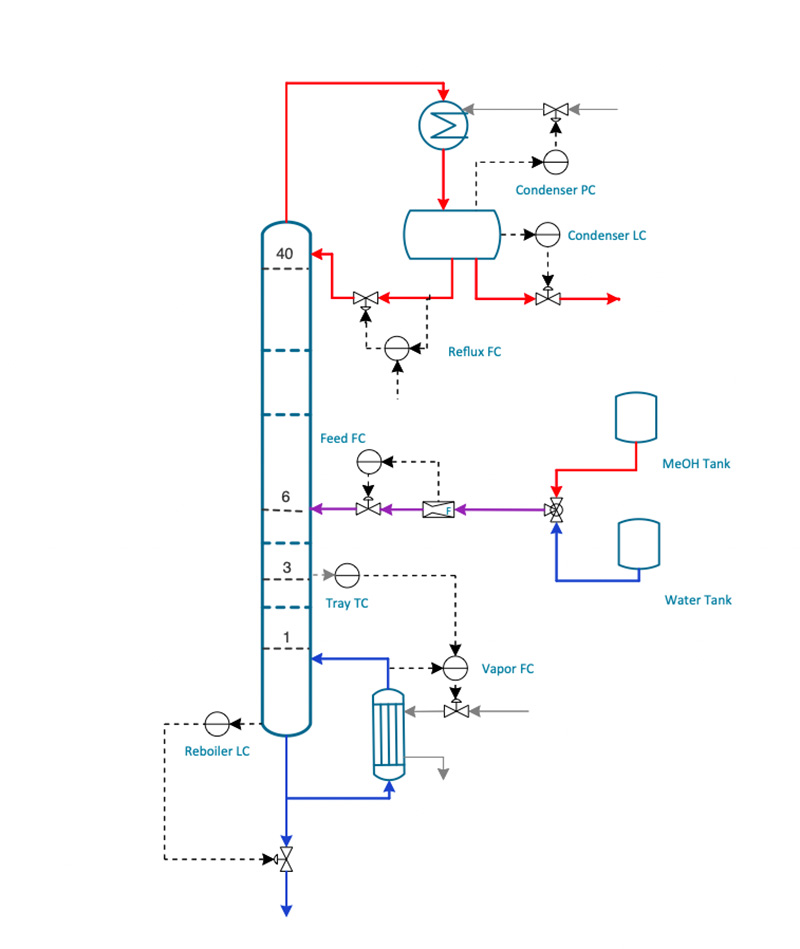
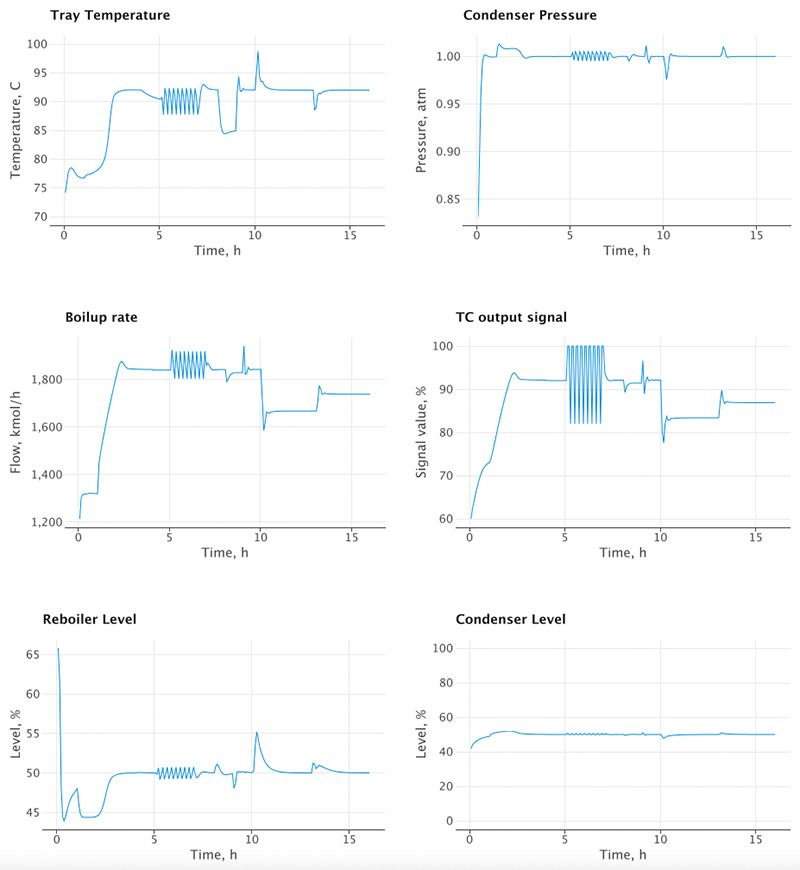
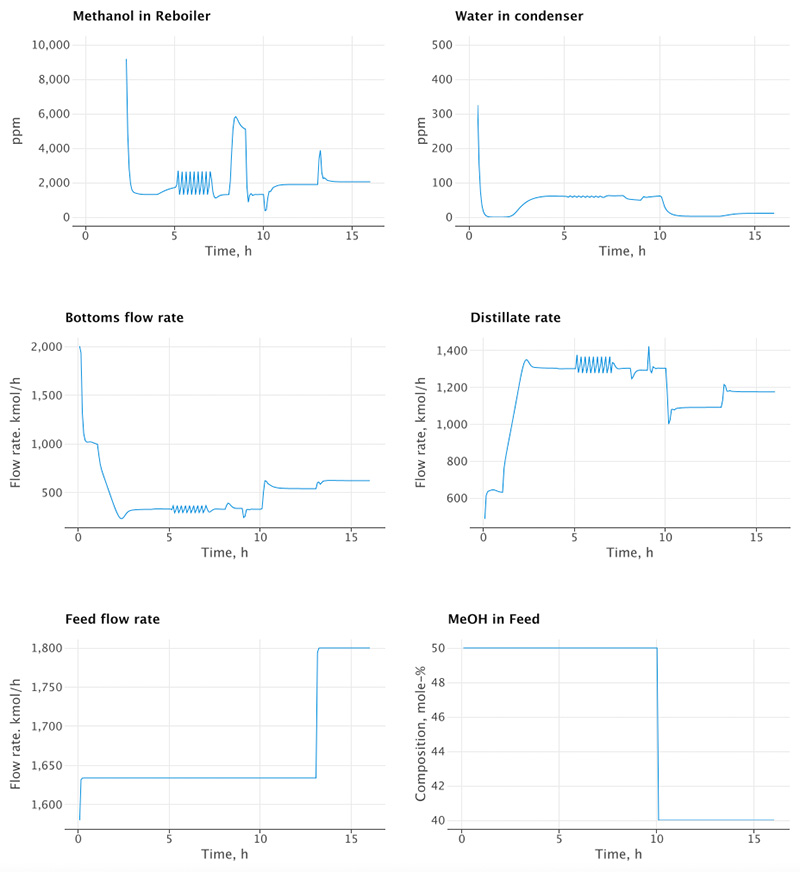
Earlier this year I posted the description, and implementation, of a distillation column simulation. The focus then was on object-oriented modeling in dynamic simulations. I collected the results of a 16 hour run in arrays which were later plotted using Let’s plot.
Since then I have come to appreciate TornadoFX as a UI tool. In my most recent post I showed how it is possible to build an interactive simulation app to plot the results of a fairly simple model, namely Burgers’ Equation. The simulation was batch in the sense that it only ran for a pre-specified amount of time. Thus, while interactive, this feature had somewhat limited use (e.g. “Pause”, “Resume”, and “Speed up” for example). The real benefit of interactive is for continuous time simulations. As I will show here, this can be done with TornadoFX as well.
The ideal candidate for continuous time simulation is a model of a continuously operating process. The distillation column is such a candidate. Now let me make another plug for MVC. Because I always separate the model from the UI, I could readily take the exact same distillation column model, that I had previously used with Let’s plot, and now use it with TornadoFX.
Results
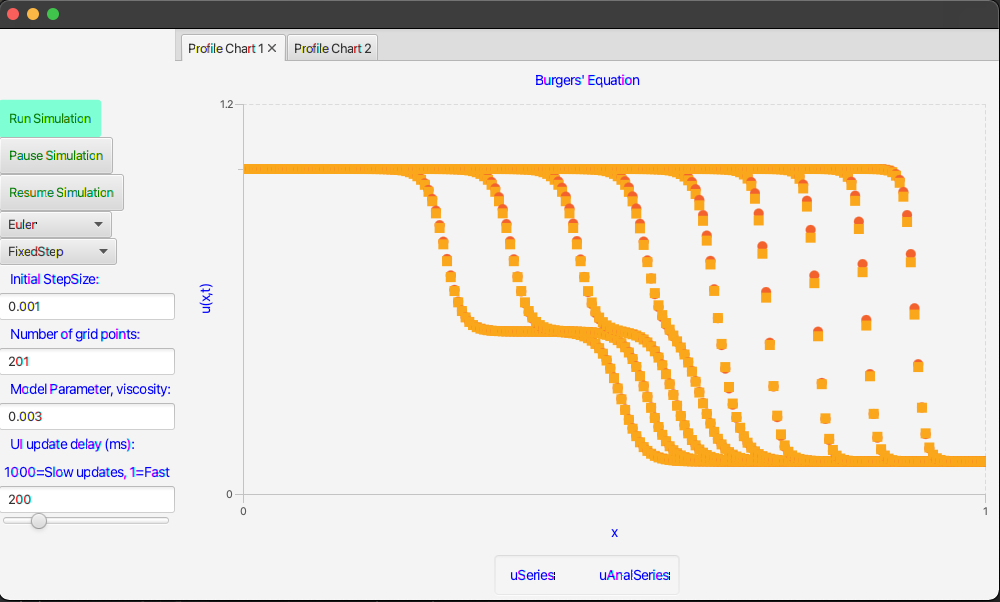
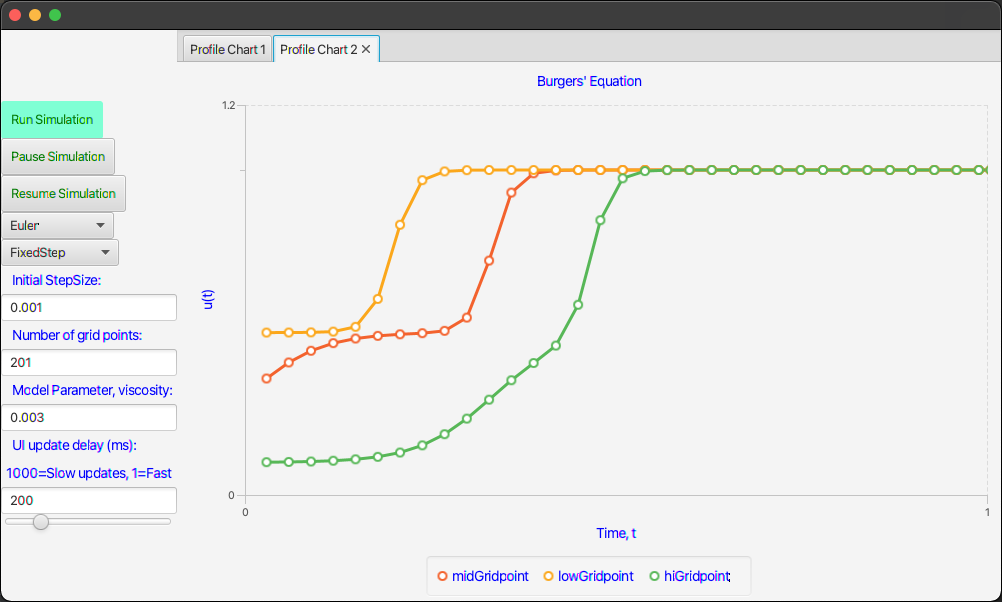
Since I had the model and the basic forms of the View and ViewController, I could build on those pieces to enhance the interface as shown below:
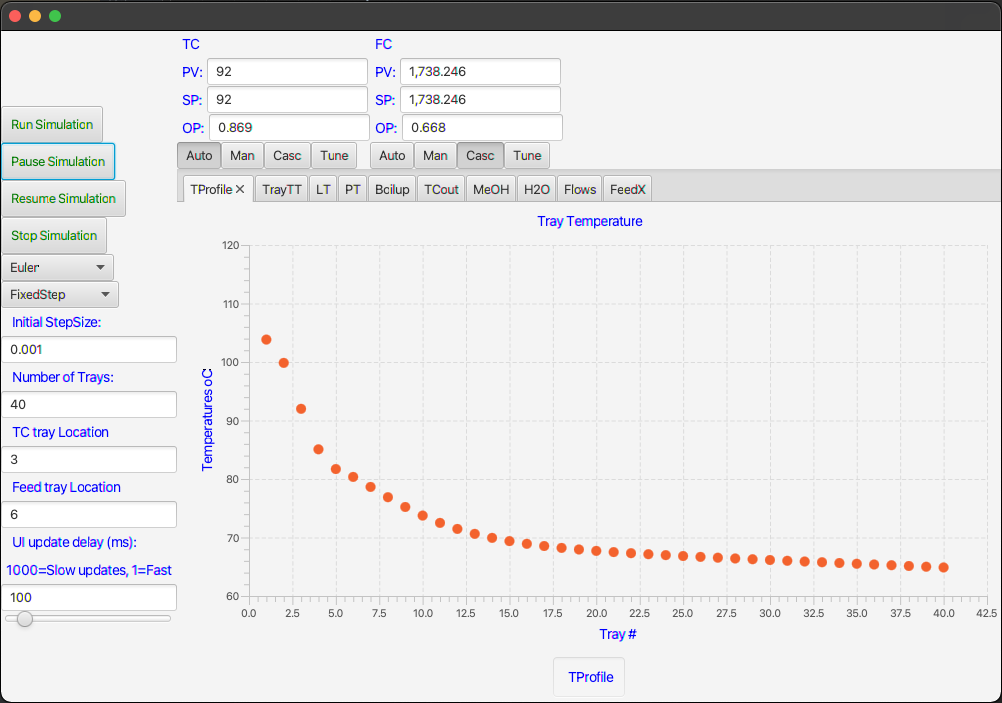
As you can see I have kept most of the controls on the left panel but added several more plot-tabs in addition to two (PID)-controller faceplates. I attach a short video of how I use the interface.
Implementation
In the spirit of sharing and teaching I show most of the relevant code for making this interface. For example, the code below is the entire code for the main view. Notice that it describes only what you will see, not how the UI responds. The latter is the task for the ViewController.
The layout in this case is guided by three very useful items: “border pane”, “vbox”, and “hbox”. The border pane gives the overall structure of the interface, whereas the two boxes are used to position related items either vertically or horizontally. By alternating the use of these boxes you can get your buttons and fields to fall in whichever place you desire.
Both buttons and textfields have the option to use an “action” in which you call the appropriate function in the ViewController to respond to user requests.
package view
import controller.ViewController
import javafx.geometry.Pos
import javafx.scene.chart.NumberAxis
import javafx.scene.layout.Priority
import tornadofx.*
var viewController = find(ViewController::class)
class MainView: View() {
override val root = borderpane {
left = vbox {
alignment = Pos.CENTER_LEFT
button("Run Simulation") {
action {
viewController.runSimulation()
}
}
button("Pause Simulation") {
action {
viewController.pauseSimulation()
}
}
button("Resume Simulation") {
action {
viewController.resumeSimulation()
}
}
button("Stop Simulation") {
action {
viewController.endSimulation()
}
}
combobox(viewController.selectedDiscretizer, viewController.dicretizers)
combobox(viewController.selectedStepController, viewController.stepControllers)
label(" Initial StepSize:")
textfield(viewController.initStepSize)
label(" Number of Trays:")
textfield(viewController.numberOfTrays)
label(" TC tray Location")
textfield(viewController.temperatureTrayLocation)
label(" Feed tray Location")
textfield(viewController.feedTrayLocation)
label(" UI update delay (ms):")
label("1000=Slow updates, 1=Fast")
textfield(viewController.simulator.sliderValue)
slider(min=1, max=1000, value = viewController.simulator.sliderValue.value) {
bind(viewController.simulator.sliderValue)
}
}
center = vbox {
hbox {
vbox {
label("TC")
hbox {
label("PV:")
textfield(viewController.tc.pv)
}
hbox {
label("SP:")
textfield(viewController.tc.sp) {
action {
viewController.tc.newSP()
}
}
}
hbox {
label("OP:")
textfield(viewController.tc.op) {
action {
viewController.tc.newOP()
}
}
}
hbox {
togglebutton("Auto", viewController.tc.toggleGroup) {
action { viewController.tc.modeChange() }
}
togglebutton("Man", viewController.tc.toggleGroup) {
action { viewController.tc.modeChange() }
}
togglebutton("Casc", viewController.tc.toggleGroup) {
action { viewController.tc.modeChange() }
}
togglebutton("Tune", viewController.tc.toggleGroup) {
action { viewController.tc.modeChange() }
}
}
}
vbox {
label("FC")
hbox {
label("PV:")
textfield(viewController.fc.pv)
}
hbox {
label("SP:")
textfield(viewController.fc.sp) {
action {
viewController.fc.newSP()
}
}
}
hbox {
label("OP:")
textfield(viewController.fc.op) {
action {
viewController.fc.newOP()
}
}
}
hbox {
togglebutton("Auto", viewController.fc.toggleGroup) {
action { viewController.fc.modeChange() }
}
togglebutton("Man", viewController.fc.toggleGroup) {
action { viewController.fc.modeChange() }
}
togglebutton("Casc", viewController.fc.toggleGroup) {
action { viewController.fc.modeChange() }
}
togglebutton("Tune", viewController.fc.toggleGroup) {
action { viewController.fc.modeChange() }
}
}
}
}
tabpane {
vgrow = Priority.ALWAYS
tab("TProfile") {
scatterchart("Tray Temperature", NumberAxis(), NumberAxis()) {
//createSymbols = false
yAxis.isAutoRanging = false
val xa = xAxis as NumberAxis
xa.lowerBound = 1.0
xa.upperBound = 40.0
xa.tickUnit = 5.0
xa.label = "Tray #"
val ya = yAxis as NumberAxis
ya.lowerBound = 60.0
ya.upperBound = 120.0
ya.tickUnit = 10.0
ya.label = "Temperatures oC"
series("TProfile") {
data = viewController.tempProfile
}
}
}
tab("TrayTT") {
linechart("Tray Temperature", viewController.xAxisArray[0], NumberAxis()) {
createSymbols = false
yAxis.isAutoRanging = false
val ya = yAxis as NumberAxis
ya.lowerBound = 65.0
ya.upperBound = 120.0
ya.tickUnit = 5.0
ya.label = "Temperatures oC"
series("Temperature") {
data = viewController.tempList
}
}
}
tab("LT") {
linechart("Levels", viewController.xAxisArray[1], NumberAxis()) {
createSymbols = false
yAxis.isAutoRanging = false
val ya = yAxis as NumberAxis
ya.lowerBound = 40.0
ya.upperBound = 80.0
ya.tickUnit = 10.0
ya.label = "Level %"
series("Reboiler Level") {
data = viewController.reboilLevelList
}
series("Condenser Level") {
data = viewController.condenserLevelList
}
}
}
tab("PT") {
linechart("Column Pressure", viewController.xAxisArray[2], NumberAxis()) {
createSymbols = false
yAxis.isAutoRanging = false
val ya = yAxis as NumberAxis
ya.lowerBound = 0.75
ya.upperBound = 1.25
ya.tickUnit = 0.05
ya.label = "Pressure, atm"
series("Pressure") {
data = viewController.pressureList
}
}
}
tab("Boilup") {
linechart("Reboiler Boilup", viewController.xAxisArray[3], NumberAxis()) {
createSymbols = false
yAxis.isAutoRanging = false
val ya = yAxis as NumberAxis
ya.lowerBound = 1500.0
ya.upperBound = 2000.0
ya.tickUnit = 100.0
ya.label = "Flow, kmol/h"
series("Temperature") {
data = viewController.boilupList
}
}
}
tab("TCout") {
linechart("TC output signal", viewController.xAxisArray[4], NumberAxis()) {
createSymbols = false
yAxis.isAutoRanging = false
val ya = yAxis as NumberAxis
ya.lowerBound = 60.0
ya.upperBound = 100.0
ya.tickUnit = 10.0
ya.label = "Signal value %"
series("TCout") {
data = viewController.tcOutList
}
}
}
tab("MeOH") {
linechart("Methanol in Reboiler", viewController.xAxisArray[5], NumberAxis()) {
createSymbols = false
yAxis.isAutoRanging = false
val ya = yAxis as NumberAxis
ya.lowerBound = 0.0
ya.upperBound = 10000.0
ya.tickUnit = 2000.0
ya.label = "ppm"
series("MeOH") {
data = viewController.meohBtmsList
}
}
}
tab("H2O") {
linechart("Water in condenser", viewController.xAxisArray[6], NumberAxis()) {
createSymbols = false
yAxis.isAutoRanging = false
val ya = yAxis as NumberAxis
ya.lowerBound = 0.0
ya.upperBound = 400.0
ya.tickUnit = 50.0
ya.label = "ppm"
series("H2O") {
data = viewController.h20OHList
}
}
}
tab("Flows") {
linechart("Feed, Btms and Dist flow", viewController.xAxisArray[7], NumberAxis()) {
createSymbols = false
yAxis.isAutoRanging = false
val ya = yAxis as NumberAxis
ya.lowerBound = 0.0
ya.upperBound = 2000.0
ya.tickUnit = 200.0
ya.label = "kmol/h"
series("Feed") {
data = viewController.feedRateList
}
series("Btms") {
data = viewController.btmsFlowList
}
series("Dist") {
data = viewController.distList
}
}
}
tab("FeedX") {
linechart("MeOH in Feed", viewController.xAxisArray[8], NumberAxis()) {
createSymbols = false
yAxis.isAutoRanging = false
val ya = yAxis as NumberAxis
ya.lowerBound = 30.0
ya.upperBound = 60.0
ya.tickUnit = 5.0
ya.label = "Composition, mole-%"
series("FeedX") {
data = viewController.feedCmpList
}
}
}
}
}
}
}I’m not showing the ViewController code here as it is quite similar to what I had previously shown in my most recent post. However, there is a piece of new code that is quite important and sits between the model and the interface. This is a class to handle the display and actions of the PID-controller faceplates. This code is shown here.
package controller

import instruments.ControlMode
import instruments.PIDController
import javafx.beans.property.SimpleDoubleProperty
import javafx.scene.control.ToggleButton
import javafx.scene.control.ToggleGroup

class PIDViewController(var pid: PIDController) {
    val pv = SimpleDoubleProperty(pid.pv)
    val sp = SimpleDoubleProperty(pid.sp)
    val op = SimpleDoubleProperty(pid.output)
    var mode = "Auto"

    val toggleGroup = ToggleGroup()
    fun update() {
        pv.value = pid.pv
        if (mode != "Man") {
            op.value = pid.output
        }
        if (mode == "Casc" || mode == "Man") {
            sp.value = pid.sp
        }
    }
    fun modeChange() {
        val button = toggleGroup.selectedToggle as? ToggleButton
        val buttonText = button?.text ?: "Null"
        when (buttonText) {
            "Auto" -> {
                pid.controllerMode = ControlMode.automatic
                mode = "Auto"
            }
            "Man" -> {
                pid.controllerMode = ControlMode.manual
                mode = "Man"
            }
            "Casc" -> {
                pid.controllerMode = ControlMode.cascade
                mode = "Casc"
            }
            "Tune" -> {
                pid.controllerMode = ControlMode.autoTune
                mode = "Tune"
            }
            else -> {}
        }
    }
    fun newSP() {
        pid.sp = sp.value
    }
    fun newOP() {
        pid.output = op.value
    }
}
This class is akin to a view controller in that has properties that can be displayed in the main interface. However, it also owns a reference to an actual PID controller in the process model. That way we can interactively interpret user input and convey them to the model.
Conclusions
Interactive dynamic simulations are extremely useful tools in the exploration, understanding and control of real processes. Over the years I have built many models with different interfaces for different platforms. I find Kotlin and TornadoFX to be a very powerful combination for desktop applications compiled for the JVM.
